Fed Update: A WILDLY Bullish Sign
|
Note From Dustin: Welcome to a special edition of our newest e-letter, Truth & Trends with Enrique Abeyta. The service is so new that it doesn't have a website yet. It is currently e-mail only. So if you'd like to receive Enrique's daily trading insights, you will need to sign up for a FREE subscription here. |
Welcome!
My name is Enrique Abeyta. Here at Truth & Trends, I have two very simple goals:
To help make you a more successful investor by breaking down the market's biggest moves...
And to cover the stories you won't find anywhere else, telling you exactly what you need to know.
Yesterday's rate cut is obviously the biggest event in the market all week — if not all year.
But from what I've seen so far, the media coverage of the Fed announcement completely misses the mark.
So what better way than that to kick off our first issue? Here's the real story...
What History Has to Say About Rate Cuts
The last few weeks have been busy for economic news. Coming into this week, we had major jobs and inflation reports that impacted the stock market.
It all culminated with the September meeting of the Board of Governors of the Federal Reserve Bank where they cut interest rates by 50 basis points.
This was the first rate cut since COVID, and speculation about the exact percentage cut and its impact dominated the financial media.
As I listened to the commentary, I was reminded that the financial media is not here to educate or inform us…
They’re here to get us to engage, and the best way to do that is to share perspectives that drive fear in their readers.
Our job at Truth & Trends, though, is to cut through media “narrative” and give you an objective perspective.
In this context, I think it’s interesting to look at the history of the stock market after Fed Rate cuts across the last 50 years.
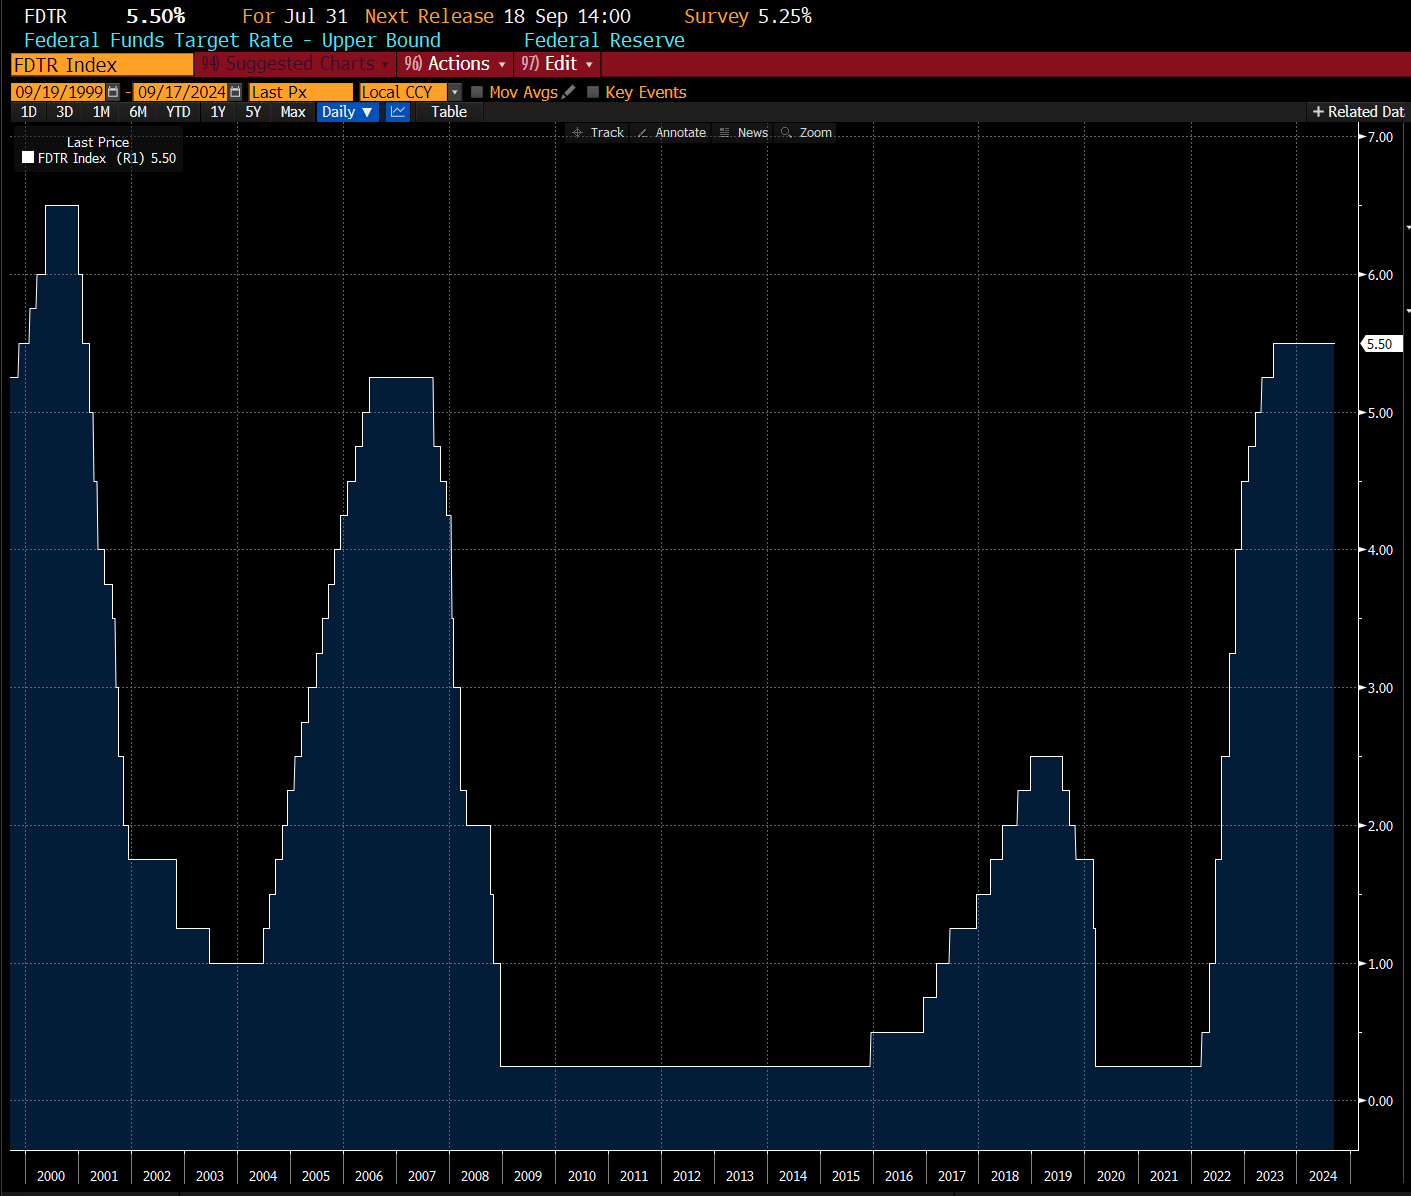
Here’s the chart of the upper bounds of the Fed Funds Target rate over the last 25 years…

Source: Bloomberg Finance LP
This is the rate the Fed sets for banks to borrow from them, as well as other banks.
One aspect of the chart that is clear is that there has been tremendous volatility in rates.
Back in late 2000 and the bursting of the Internet 1.0 tech bubble, the Fed cut the target rate from 6.50% to less than 2% in under a year. They kicked it off with a 0.50% cut off the bat.
This set off another sudden drop in rates in response to the global financial crisis, and this time rates fell from a little more than 5% to almost 0% in a little bit more than a year. They again kicked it off with a 0.50% cut straight away.
Both these periods of rate cuts were in response to extreme financial crisis. They can essentially be viewed as “panic” cuts. The Fed was trying to save the US economy and worked aggressively to do so.
We can see this again during COVID when the Fed also aggressively cut the Fed funds rate — not by as much, but still in response to a major crisis.
Unsurprisingly, if you look at the performance of the S&P 500 after these big rate cuts, it was bad. Here is a table showing how the stock market performed after the first rate cut…

You can see that after the cuts in 2001 and 2007, the stock market got crushed to the lows. In both cases, it was essentially cut in half.
The COVID environment was very different economically. But even in this instance, the S&P 500 lost a quarter of its value.
Looking at this data over the last 25 years, it would seem logical that investors should be concerned about this first rate cut.
While 25 years might feel like a long time for you and me, it’s not that long in economic history.
This is where looking at the history of rate cuts in the 25 years prior plays a role. Here is that data…

This data looks a lot different.
In all cases, the stock market still sold off some. But in only one case (1981) did it sell off double digits.
Also, the stock market was up nicely six months later in every one of these instances except that one.
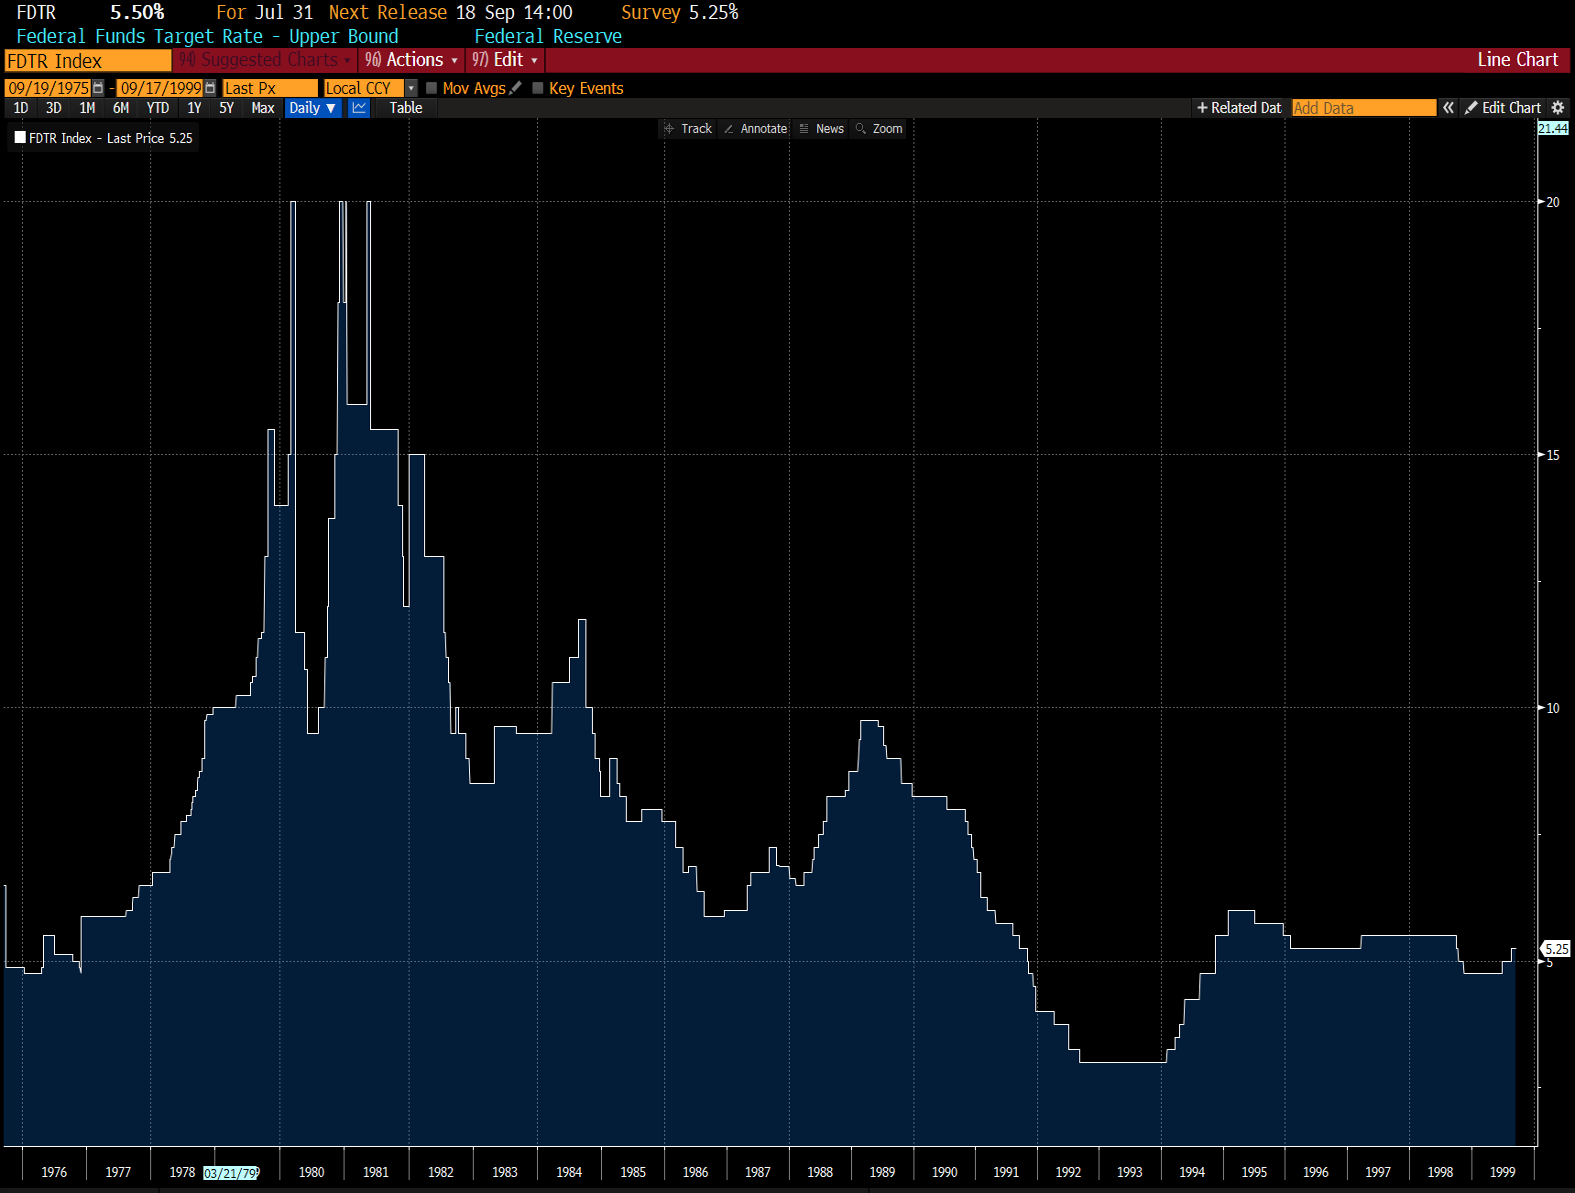
These periods did see big movements in the Fed funds rate. Here is the chart of the rate for these 25 years…

Source: Bloomberg Finance LP
Most of these periods, though, occurred with the natural ebbs and flows of the economy and NOT in response to a major financial crisis.
The fact is that for many decades, the U.S. economy has been able to operate without going in and out of crisis.
It has really only been the most recent 25 years and — in particular — the period from 1999 to 2011 that we saw this “schizophrenia” in the markets.
Most of the time, the Fed can cut (and raise) rates to moderate economic activity without causing a major disruption.
I have been an active trader in the markets since 1995, and I remember these periods well. This is difficult for most investors because they have never seen this kind of market.
Do I think the 1980s and 1990s type of market environment is what is happening now? I absolutely do.
I think there are certainly concerns in the economy, but there’s nothing that looks at all like the tech or housing bubbles.
We are rather in a period where the Fed wants to help the economy by moving the dial a little.
With a longer historical view, this is actually the rule and not the exception.
So tune out the “noise” from the media that wants you to be scared by the rate cut.
Instead, look at the longer track record and understand that this could be setting us up for a great market environment.
|
Remember: The all-new Truth & Trends is currently e-mail only. Get a FREE subscription here. |


